Combining continuous cyber asset management and discovery with real-time visibility and automated business service graphing is changing the game for cloud migrations. Our new interactive consoles visualize complex data to accelerate cloud migration and reduce migration risk for even the most complex business services.
Cloud migration assessments have traditionally started with a budgetary evaluation, typically run over a short period of time, compiling a snapshot view of an IT estate. In these budgetary assessments, it isn’t financially practical to have people manually group discovered cyber assets into business services. However, any real insights into a migration plan come from understanding the details of these business services, which must be inspected to look for critical dependencies on other applications or business services. In this scenario, a second assessment is always required to provide any sort of actionable migration plan.
Even when an initial budgetary assessment provides enough feedback to proceed with a more thorough look at the IT estate, the process of grouping cyber assets into business services remains manual, time-consuming and error-prone. Furthermore, as time passes from the assessment, confidence in the manual dependency mapping and business analysis plummets while the risks of breaking business services in the migration increase geometrically as changes are continuously made in all of the IT environments.
Combine Budgetary and Migration Assessments into a Single Step
In order to dramatically increase confidence, reduce risk and accelerate the completion of migration projects, CloudSphere has launched a set of interactive consoles that visualize the comprehensive set of insights derived from our unique cyber asset management platform. Rather than running two separate assessments as part of the migration process, CloudSphere’s unique approach combines the budgetary and migration assessments into a single step, saving time and money. CloudSphere achieves this by automating both the continuous discovery and business service grouping when helping companies prepare for a cloud migration. This includes the continuous scanning needed to maintain an accurate view of the IT estate and delivered through the continuously updated consoles. The customizable consoles, unique in the industry, provide insights in real time to accelerate cloud migrations, optimize workload placement and reduce migration risk.
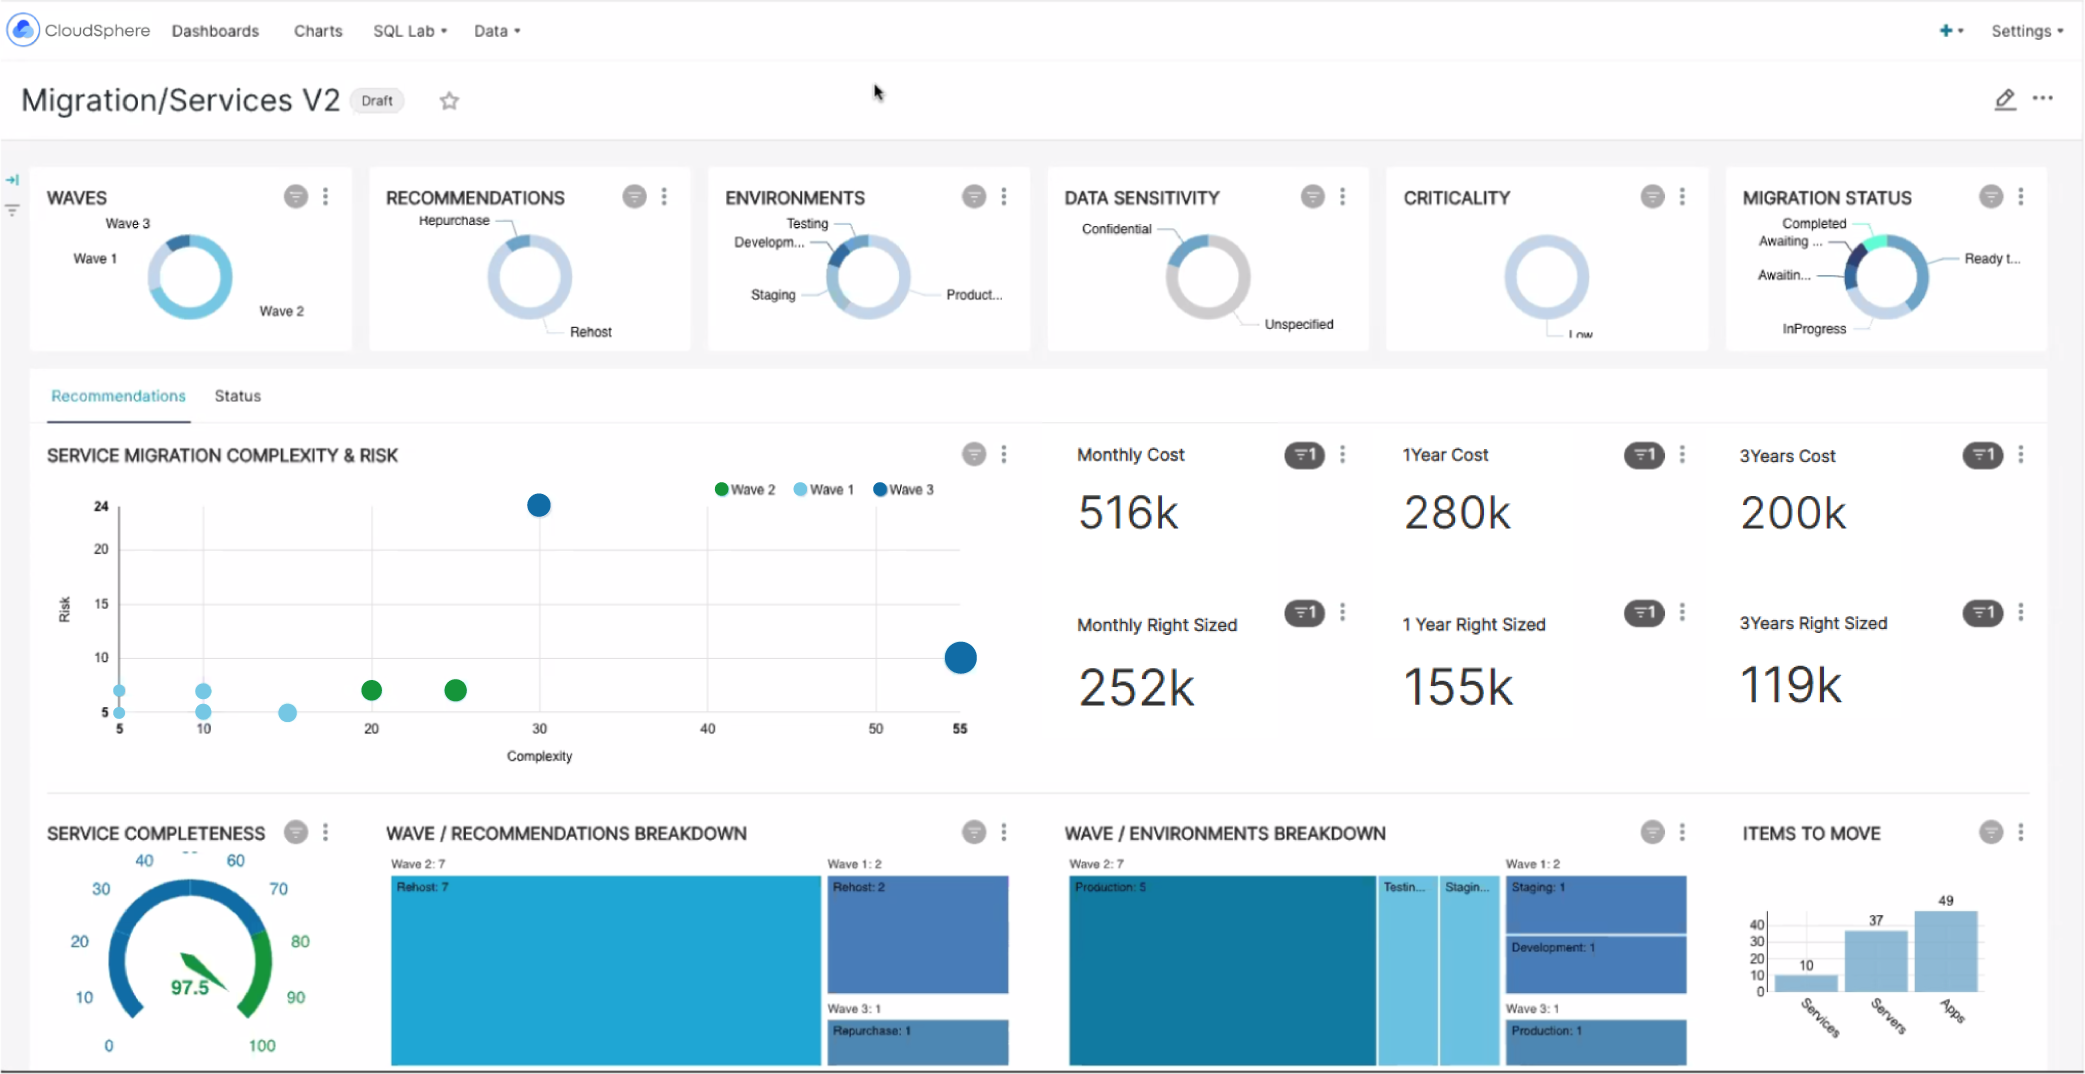
This interactive migration console view takes information gleaned from our discovery process and combines it with our automated business service graphing to deliver unparalleled insights.
Detailed Dependency Maps Identify Business Services Best Suited for Cloud Migration
In order to accelerate cloud migrations, CloudSphere provides detailed migration wave plans that allow users to understand which business services will be most easy to move to the cloud based on the risk and complexity of the environment, as well as understand which services may not be a good fit for a cloud migration. A key component of that algorithm is understanding the dependencies a particular business service may have to other applications and services. Detailed dependency maps available in the software provide an easy-to-understand visual representation of these dependencies saving operations staff countless hours of effort trying to manually correlate data from several disparate sources. When considering how to best move individual business services to the cloud, best practices commonly look to do a 6R analysis (Rehost, Replatform, Repurchase, Refactor, Retire, Retain) prior to migration. The interactive migration console automatically provides 6R guidance for each discovered business service on how to best move forward.
Increasingly Complex Migration Projects Create Increased Risk
Optimizing workload placement is another important consideration in a cloud migration. There are a number of factors that need to be taken into account, and cost optimization is always near the top of the list. The price for essentially identical cloud services can vary significantly by region or cloud provider, and this is where having an extensive database of multi-cloud costs can dramatically simplify cost optimization. Another critical factor to consider when deciding where to place a workload is the overall performance of the business service, as opposed to just looking at the performance of a particular cloud asset. When cyber assets are automatically grouped into business services, there is enough context available to look at the impact to the overall business service performance for each workload. Many of our customers are also working on sustainability initiatives, and cloud migrations are a great place to make improvements. CloudSphere’s software can identify opportunities to reduce carbon consumption based on workload placement, and provide reports showing savings over time.
Cloud migration projects have become increasingly complex, and with the increase in complexity has come an increase in risk. The risks in a cloud migration primarily stem from missing dependencies and connections between business services. When these services are moved without taking the dependencies into consideration there can be significant consequences as critical services stop working after the migration. The easiest way to reduce migration risk is to automate as much of the discovery and dependency mapping as possible, taking human error out of the equation. Because no two IT estates are the same, offering customizable inputs and service completeness graphs alongside discovery automation reduces risk even further by allowing companies a way to identify critical risk areas that must be taken into account for a particular business service, business unit or company.
Accelerate Migrations, Increase Confidence and Reduce Risk
CloudSphere’s new insight console capabilities combine continuous cyber asset discovery with real time visibility and automated business service graphing, providing a number of key benefits for our customers by visualizing the complex supporting data around the migration process. This visualization accelerates migrations, increases confidence in the process and reduces migration risk.
To learn more, sign up for our webinar or schedule a demo and see how we can help with your next project.